This blog post is a two-parts series about debugging Node.js applications. The first part focuses on post-mortem debugging tools and practices, the second part illustrates how to debug latency bubbles in production using DTrace.
Recently I was a spectator of one of the very first online conferences about the rise of a new software stack built for mobile and web applications. The new stack is NodeStack and is comprised of Node.js, MongoDB and SmartOS. It is intended to replace the now surpassed LAMP stack, as modern applications have to deal with real-time response delivered at scale, required when interacting with an exploding number of mobile devices.
NodeStack conference featured a fabulous talk by Bryan Cantrill (@bcantrill), Joyent SVP of Engineering, going through why Joyent’s operating system, SmartOS, really makes a difference within the stack. His points were so prescient, or His talk was so good that I decided to give my contribution translating it into this blog post. If debugging your Node.js apps in production sounds like a dream come true, read on!
SmartOS, the foundation of the NodeStack
Does the foundation really matter? It’s often very tempting to dismiss the foundation and concentrate on the appearance of things but, just like with buildings, the foundation is really critical and it doesn’t necessarily matter when things are working as much as when things fail.
When your program fails you need the foundation – the Operating System – to really understand what happened. When your component has failed, it’s gone and all that’s left is inside the Operating Systems, like footprints on what used to be the component.
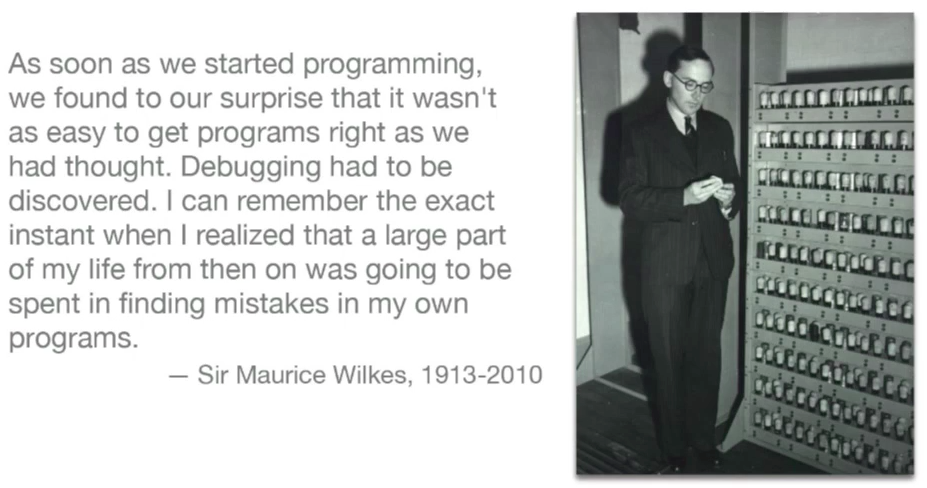
Sir Maurice Wilkes, the father of computing, built the first stored program computer back in 1949. The first programmer in history already realized that it wasn’t easy to get programs right.

SmartOS is Joyent’s open-source operating system, it is a derivative of illumos, the community driven fork of OpenSolaris that was born when the project was made proprietary. It is backed by many former Sun Microsystems engineers, and it is built to be the operating system for the cloud. You may want to check out www.smartos.org to get more information.
Debugging Node.js logic failures
First off, programs fail for internal logic errors. A bug can cause them to die, exit improperly or end up in infinite loops. To debug these kinds of failures you often need tight integration with the underlying OS.
A real use case
To give real examples, Bryan speaks to his own experience, since Joyent builds its entire software for orchestrating their cloud using Node.js. In the past, Bryan and his team, including Ryan Dahl (the creator of Node.js) and Dave Pacheco (@dapsays), were hitting a black hole by experiencing a non-systematic infinite loop inside their application right before deploying in production.
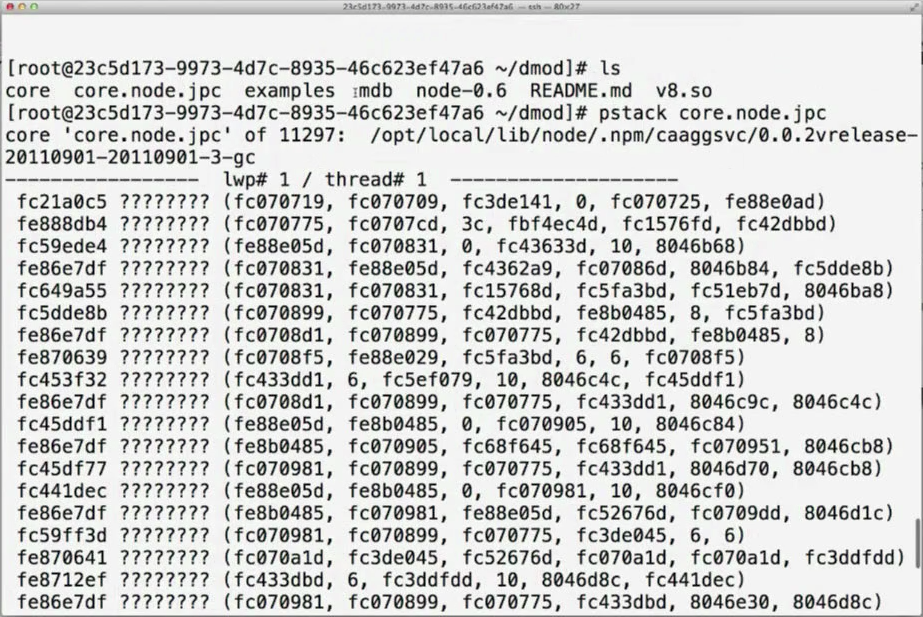
They were looking at the generated stack, which looked like this:

Obviously, you have no idea where you are in the code.
They eventually deployed the application in production and even though they expected to see the bug happening immediately, they didn’t see it for months. And here comes the difference between an amateur and a professional: an amateur happily says “the bug just went away!” while the professional knows that the bug is there and will hit him in his weakest moment. In fact, the bug actually appeared when a customer was watching a demo of the software.
Bryan and team decided they would have to write something new to help debug the software.
mdb and v8.so
Historically, we have always looked at core dumps for post-mortem debugging. It’s a very old idea commonly used to debug operating systems, databases, web servers, etc. It is really great because it allows for asynchronous debugging: after a failure, you can restart your system immediately and debug it in parallel.
The problem is that this has not worked well in interpreted environments.
The challenge for Bryan and team was to add support for post-mortem debugging for Node.js. Bryan thought it was basically impossible because it implies you are able to reconstruct the VM state. From the bottom of the system (the Operating System), it is very difficult to determine what is happening further up the stack. And this is reinforced by the fact that no one has done it satisfactorily so far, neither Java, nor Python, Ruby, Erlang or PHP. Bryan thought it was an impossible problem to solve. Dave Pacheco proved him wrong.
Among the anecdotes contained in The Soul of a New Machine by Tracy Kidder, there is one about a college hire joining an engineering team. The senior engineers didn’t have time to look after him, so they gave him an impossible problem to solve (a simulator), just to make him kill some time. But he came back after a couple of months saying, “the simulator’s done”. To their surprise, the senior engineers realized they didn’t tell him it was an impossible problem. He solved it because he didn’t know it was impossible.
In the same way, Dave Pacheco solved the problem of visualizing a stack trace for interpreted environments. The result is that now we have the v8.so dmod for mdb that can be used for debugging Node.js programs post-mortem.
Let’s take a look at how it works.
> ::load v8.so
> ::jstack
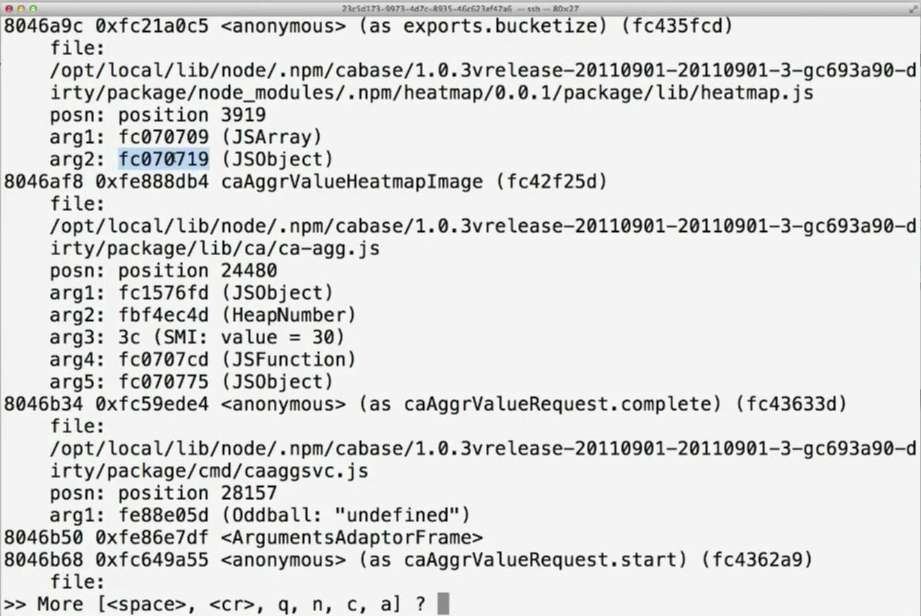
After loading v8.so, the stack trace we have seen before looks like this, displaying all the actual JavaScript frames:

Now it is definitely much easier to identify that the source of the problem is inside the heatmap.js file.
But Dave went one step further. With his dmod, we can also take an arbitrary object and see what the actual arguments are, printed out as JSON. Now, if you look at the following output, you will notice something a bit suspicious, considering that the pathology was an infinite loop.

Note that “min” and “max” have the exact same value. The heatmap.js shouldn’t be called with such parameter values but, at the same time, the function should be able to handle this situation without generating an infinite loop. Both the caller and the called were fixed.
This is a concrete example of how to understand a production problem that couldn’t be debugged in any other way than with an effective post-mortem debugging tool.
Memory leaks
“Where is my memory going?” – during the broad adoption of Java in the mid 90’s, we’ve seen the rise of garbage collector problems. Since then, programmers still see their programs spending too much time doing GC. But that happens either because of actual garbage collection or because you’re actually not generating any garbage. In the second case, it means you’ve got a semantic leak: a data structure that you don’t care about that still has a reference somewhere and GC can’t collect it. You will focus on GC as the cause of the problem when it’s just a symptom of the problem. And it’s very easy to keep implicit references in JavaScript that result in heap growth that you don’t know where it’s coming from.
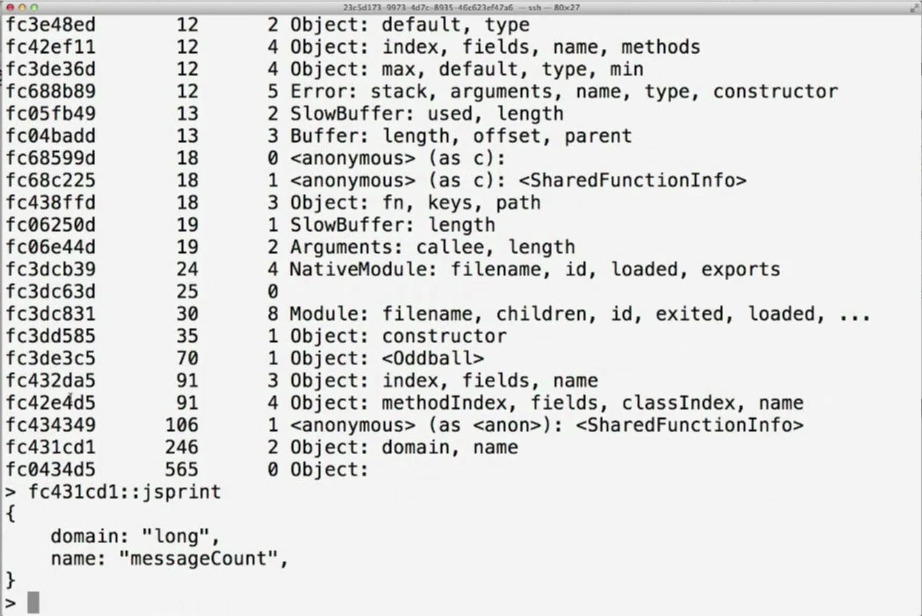
Walking the memory to find the source of leaks is not an easy task, but Dave helped solve another impossible problem. Bryan and team did it by scanning all memory looking for objects that were satisfying all the constraints that a proper JavaScript object should have.
The result is the ::findjsobjects mdb command, which scans the core file and prints out all the objects that are recognized and that can be visualized by piping their address into ::jsprint.

But to go hunting our memory leak source, we can even go further and print all JavaScript objects that match a certain object property signature.
End of part 1. To be continued here.


